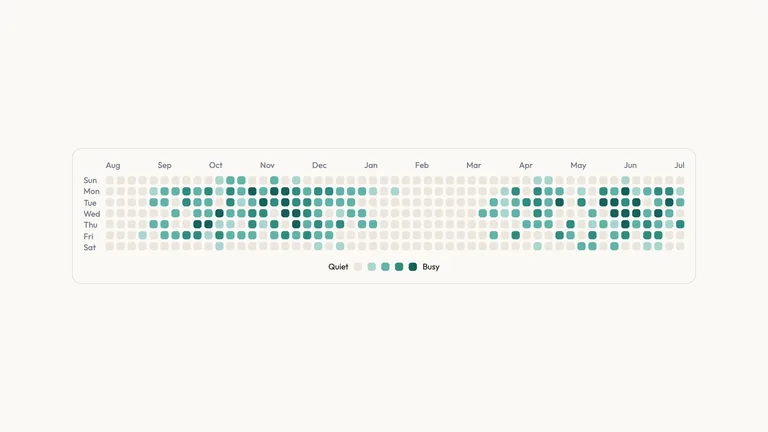


Activity Calendar Chartv1.0.1
Use this Skill to create infographic.
Popular
5.0172 downloads2 likes2 saves
Free
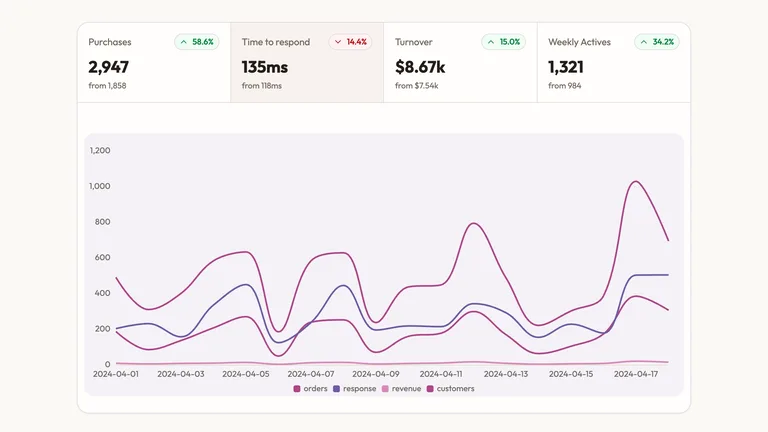
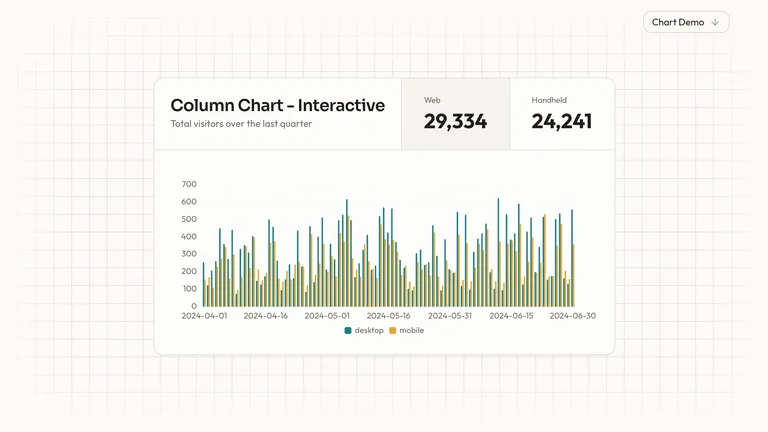
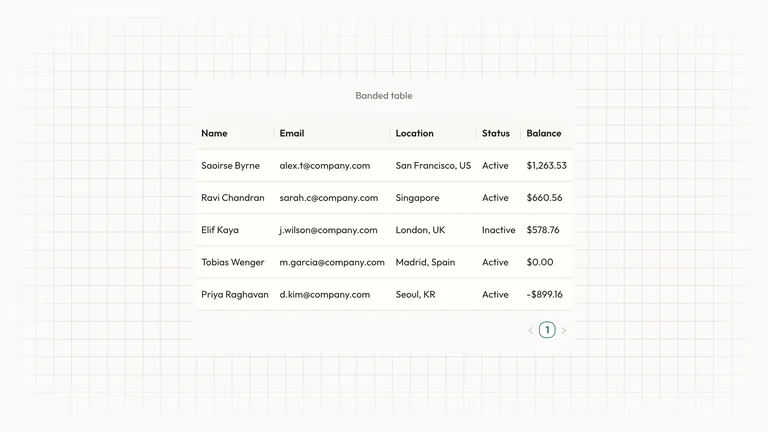
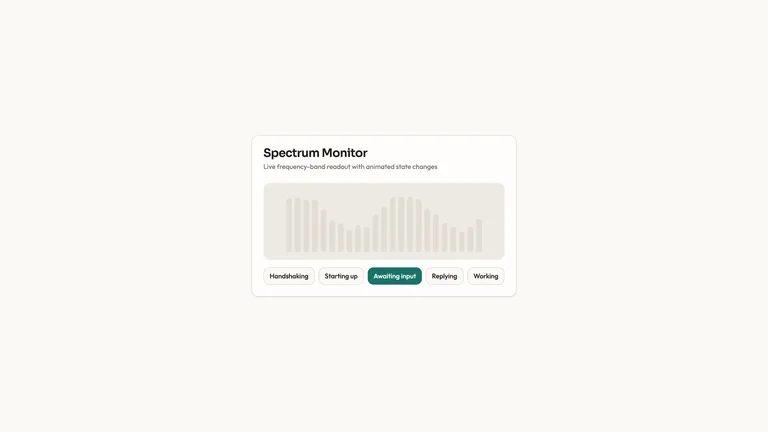
Activity Calendar Chart is a ready-to-paste data visualization, delivered as editable source with its usage example. It ships with state the visitor can change and see respond. Colour, type and radius live as tokens you edit once for the whole block.
Picked most often by
Updated Sep 22, 2026
Preview gallery
Similar Skills
View all skills
What you get
- The full source for Activity Calendar Chart — the component file plus a runnable usage example, ready to paste and edit.
- A written visual contract: palette, type scale, radius, icon stroke and motion timings, all as tokens you edit in one place.
- Responsive breakpoints already tuned, from desktop down to a phone.
Good fit
- You need a data visualization on a page and would rather not wire up a charting library.
- You want the chart palette and spacing to match the rest of the page.
- You want readable source you can edit, not another dependency to keep upgraded.
Not for
- Teams already running a mature design system — this palette and type scale will fight yours.
- Anyone wanting a versioned npm package; this hands you source to maintain yourself.
- Projects needing navigation, forms, auth or checkout — none of which this block covers.
Client & Executive ReportingResearch & Technical CommunicationWeb Design & Digital ExperiencesCreate InfographicCreate UI VisualsBuild Website PageEditable OutputVisually PolishedBeginner-friendlyWarm NeutralTeal AccentEditorial
About this Skill
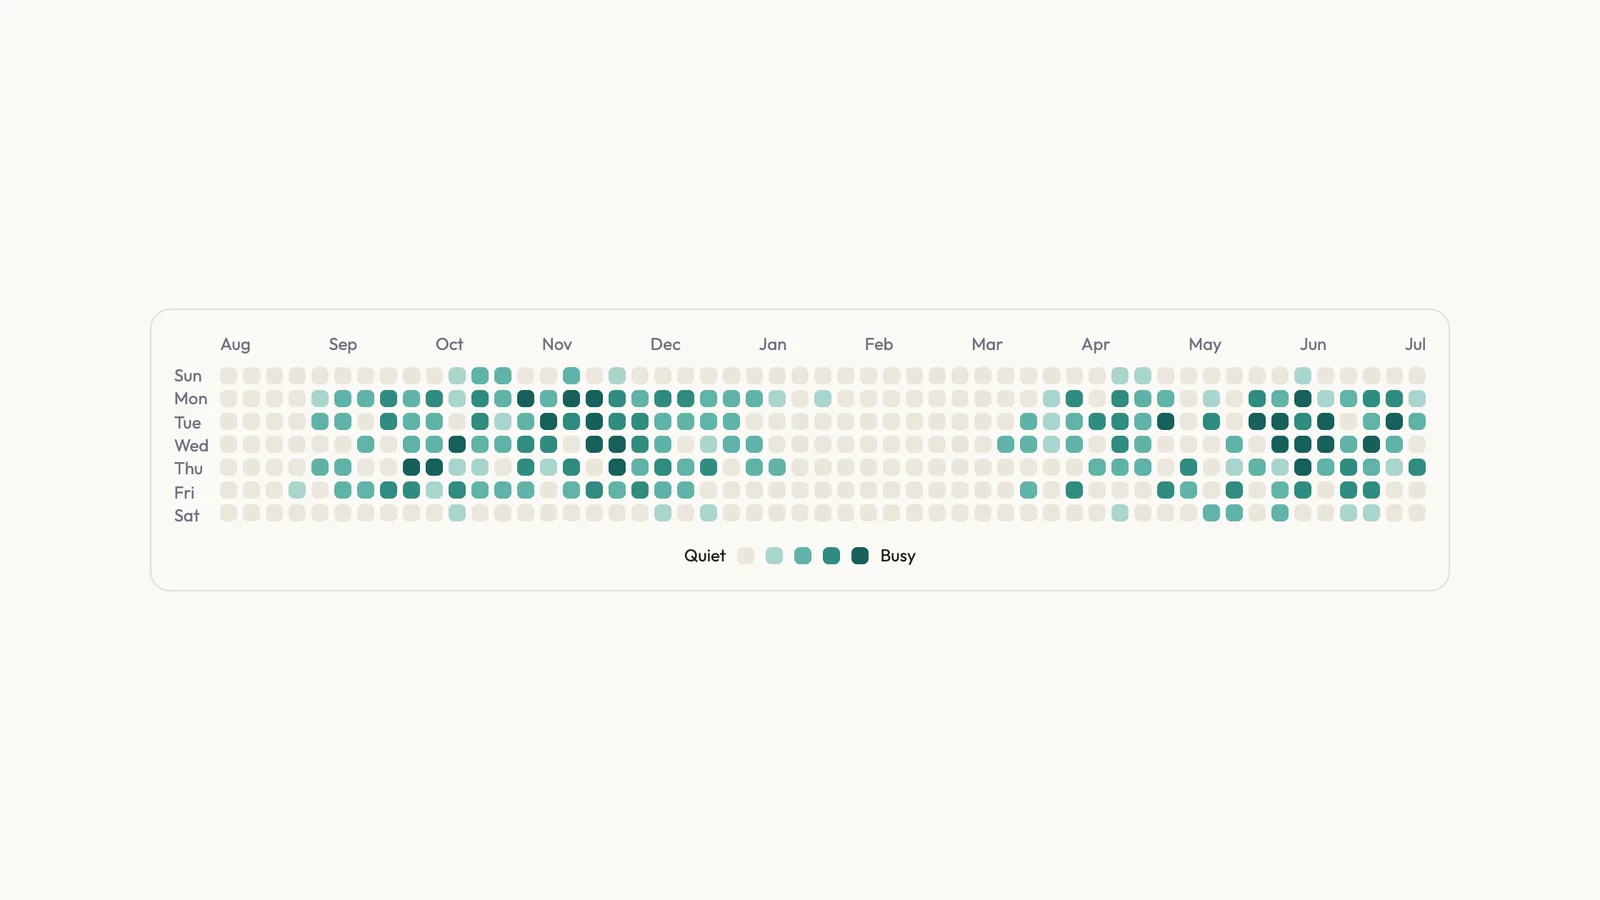
You paste one block and a real data visualization appears on the page, drawn properly rather than sketched in SVG. Put your numbers in and the shapes redraw themselves.
What you get
- The full source for Activity Calendar Chart — the component file plus a runnable usage example, ready to paste and edit.
- A written visual contract: palette, type scale, radius, icon stroke and motion timings, all as tokens you edit in one place.
- Responsive breakpoints already tuned, from desktop down to a phone.
How to use it
- Tell your assistant where the section goes and it reads your project first, then writes the block the way that project is already written.
- Replace the words with yours. The type sizes and spacing hold on their own.
- Change the accent colour in one place and the whole block follows.
- Look at it on a phone before you ship. It is already built to hold there.
What you need before you start
- Last tested
- v1.0.1 — Claude Code / Claude Desktop / Cowork / Codex / ChatGPT
User reviews
Loading reviews…