Monthly and quarterly report decks
Results, risks and next steps in a clear slide order, editable in the browser and exportable to PowerPoint.
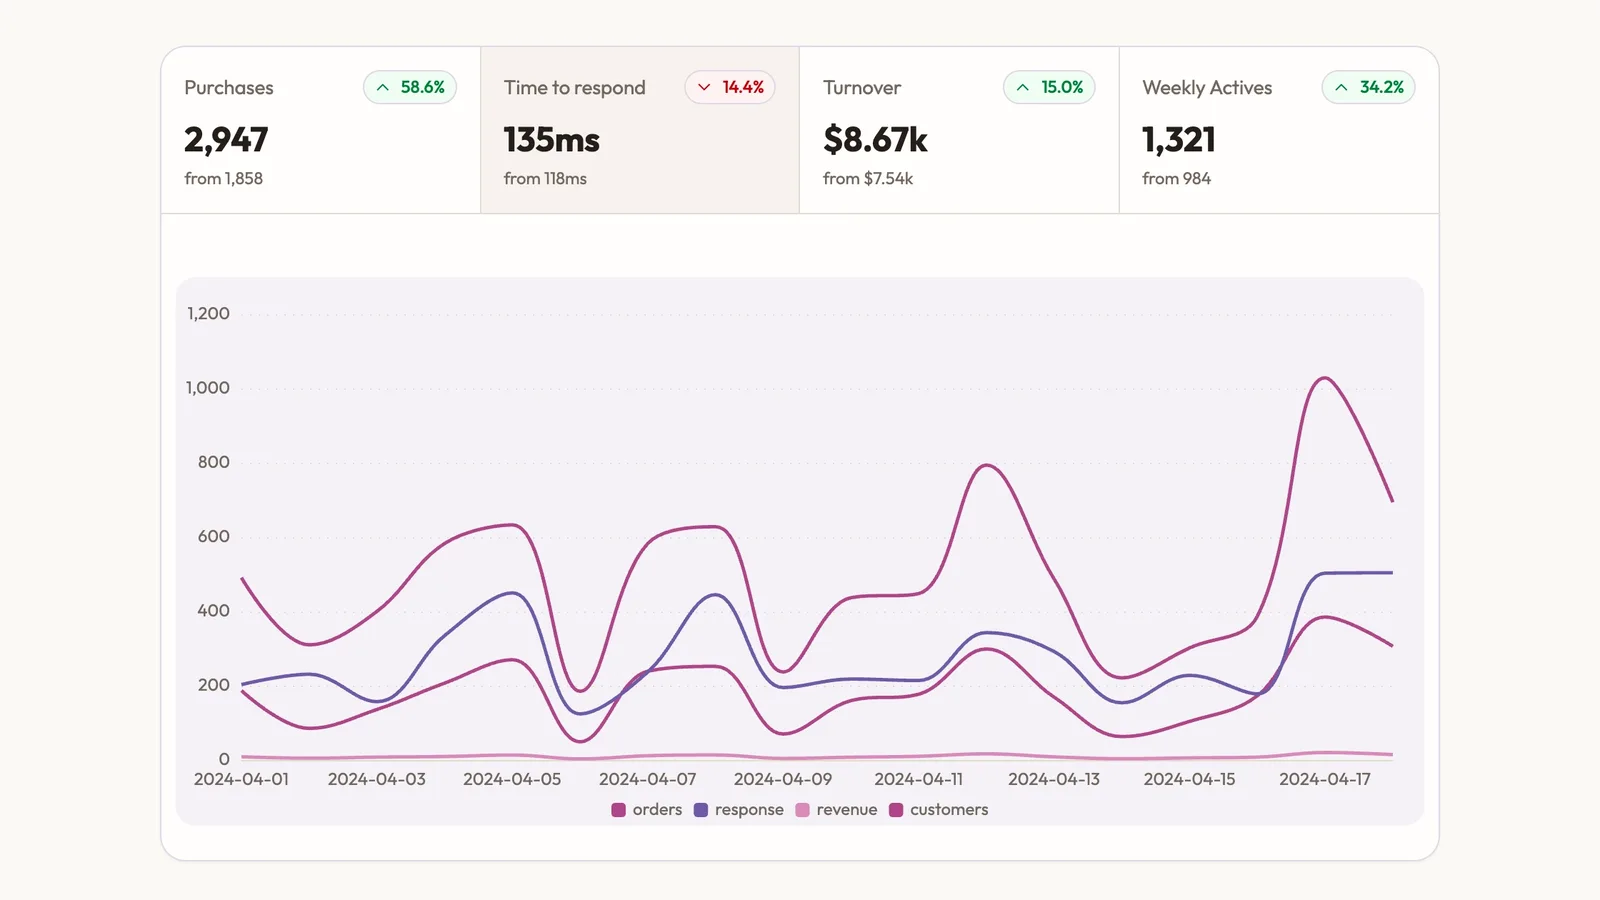
Monthly reports, quarterly reviews and KPI charts your agent builds from your numbers, in a deck clients can follow.








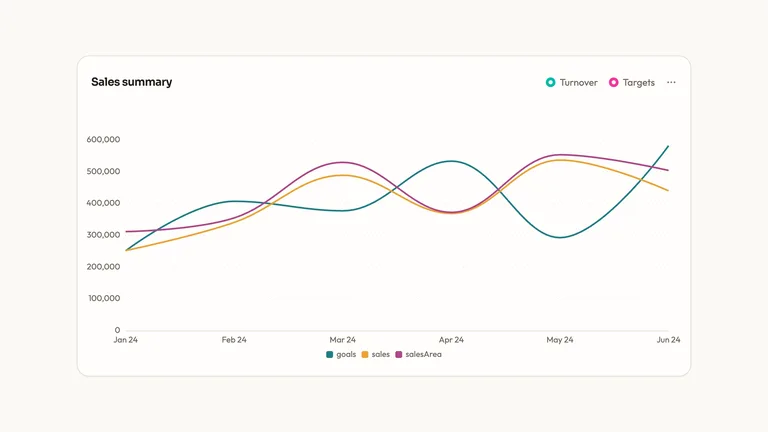
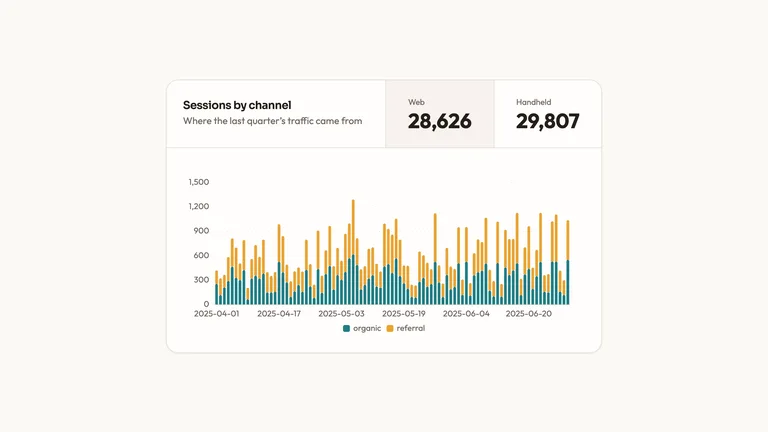
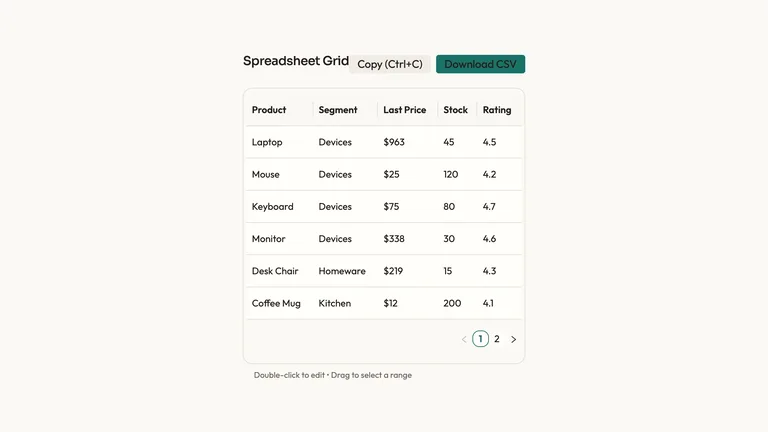

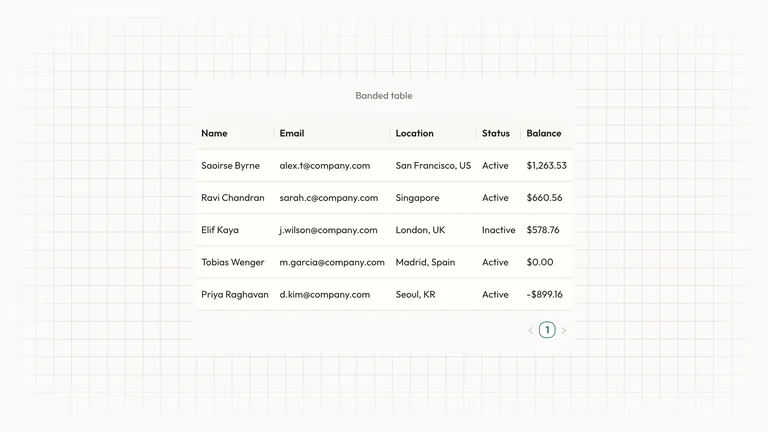

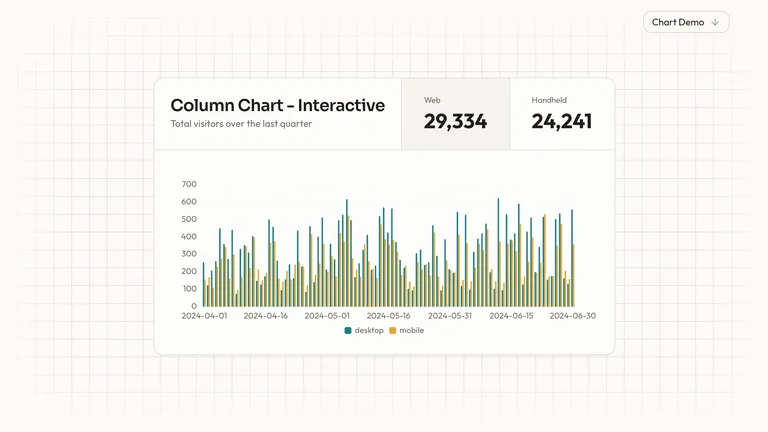
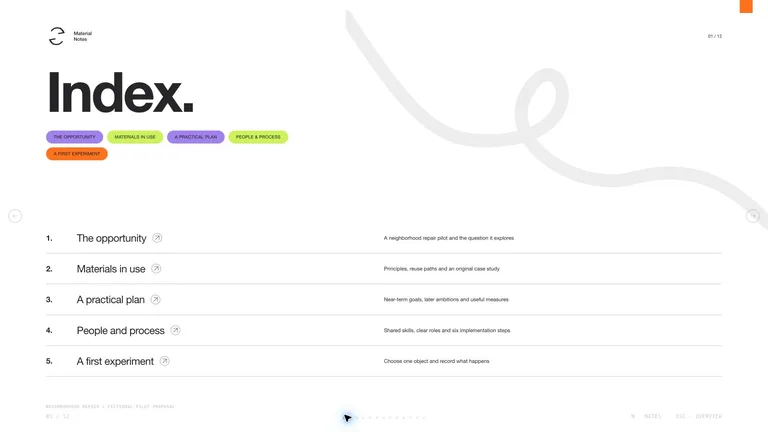
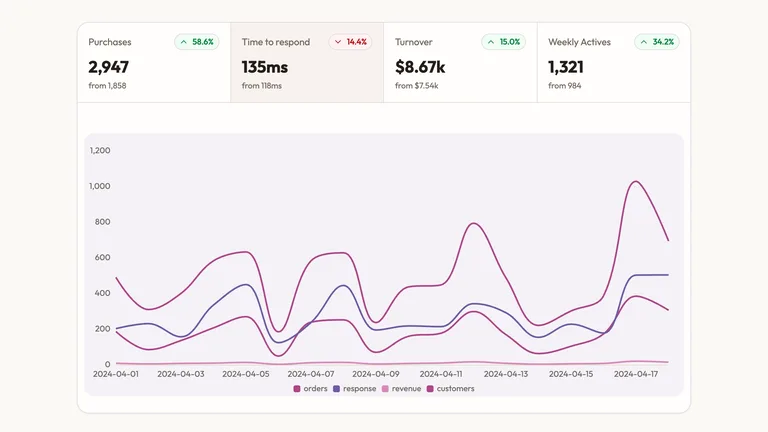

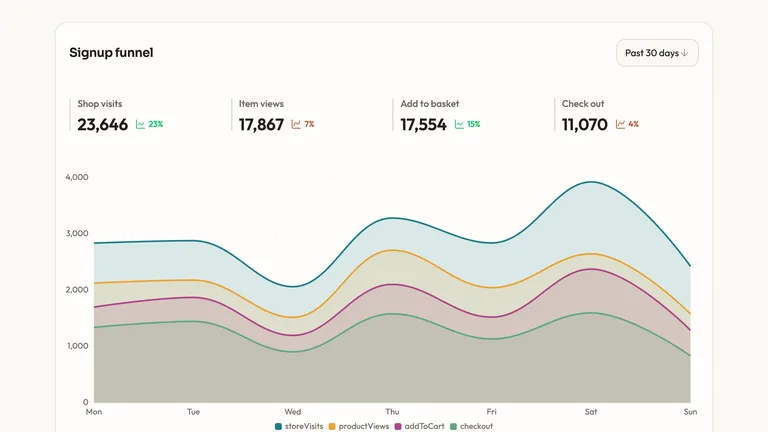

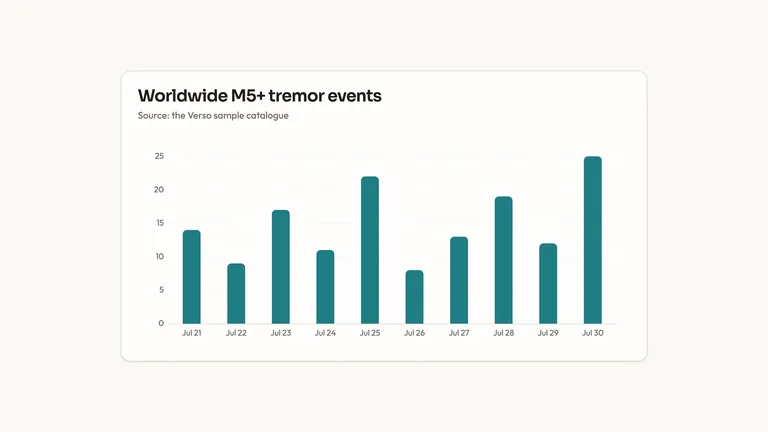
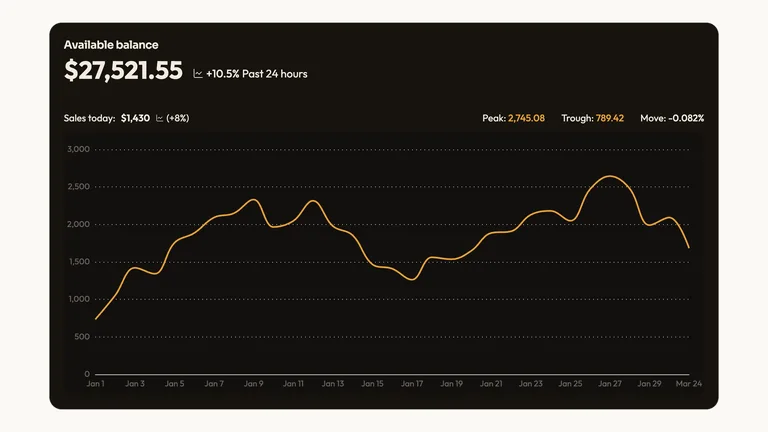

The numbers change every month; the format shouldn't. A Skill fixes the format, so your agent only swaps in new data.
Results, risks and next steps in a clear slide order, editable in the browser and exportable to PowerPoint.
The same deck style month after month, so clients always know where to find the numbers.
Bar, line, funnel and KPI chart components that keep one style across every report.
Each role page picks the Skills that fit that job best.
Three steps in Claude Code, Codex or Cursor. No design app needed.
Copy the install prompt into your agent, or run the command below. The Skill lands in your agent's skills folder.
npx skillry-cli@latest install bs-data-visualization-kpi-linesType a slash and the Skill name, then say what you want in plain words.
/bs-data-visualization-kpi-lines Turn these results into a concise client report with insights and next steps.Open the file it made, ask for changes in the same chat, then publish or hand it off.
index.htmlA prompt can summarize your findings. A Skill turns them into a report deck or a set of charts where every number traces back to its source, so the meeting can spend its time on the decision.
| Aspect | A plain prompt | A Skill |
|---|---|---|
| Numbers | You paste figures in and hope they come out unchanged | Charts are built from your data, so each figure traces back to the source |
| Storyline | A generic summary of everything | Context, finding, recommendation and next step, in that order |
| Format | You restyle the answer into slides at the end | A report deck or chart set from the start, ready for the meeting |
Install any Skill on this page and every new one we add. Cancel anytime.
Cancel anytime
$9.99 / month
Full Premium access, billed monthly.
Save 34% a year
Most popular$79 / year
Full Premium access for a lower annual price.
Pay once · Founding price
Founding offer$169 one-time
Founding price — increases as the library grows.
Cancel anytime. Payments are non-refundable.
Yes. Give your agent the spreadsheet or CSV, say how each metric is defined and which date range to use, and a chart or report deck Skill builds from it. Keep those definitions in the brief so the figures stay exact.
Use a deck when you present it live and want a decision in the room, and a chart page when the client reads it alone. For slide formats, browse presentation Skills.
No, so don't rely on it. Reconcile the final figures against your source system before the report goes out.
Share only what the report needs and follow your client agreement. Remove names and identifiers where you can, and check whether any tool the Skill calls sends data to an outside service.
Reports, summaries and review decks, ready for the meeting.
Browse all Skills