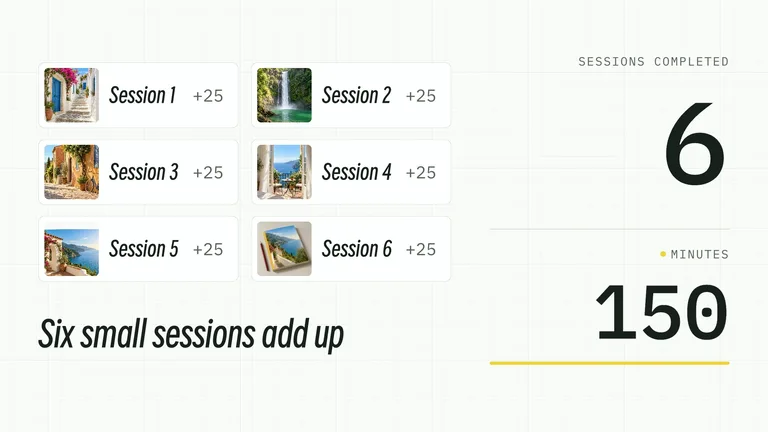
CreatorMotion · Accumulating Cards and Counter


 +7

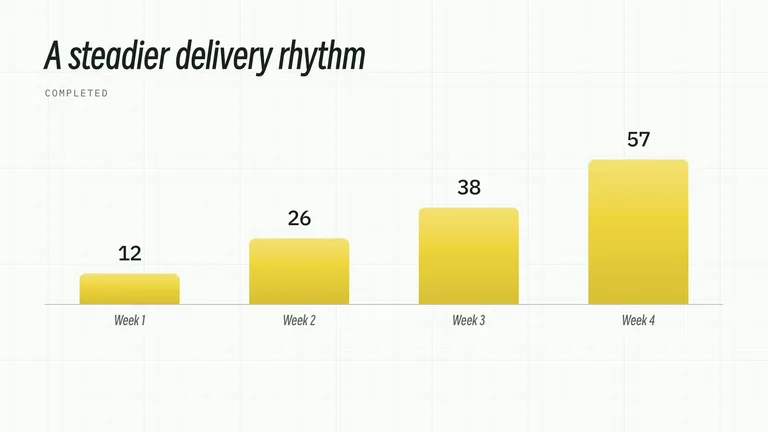
Paste CSV data to export 60fps bar chart races, line trends, transparent WebM α, or SVG free.
Turn quarterly CSV reports into full narrated data videos or interactive HTML dashboards with your AI agent.
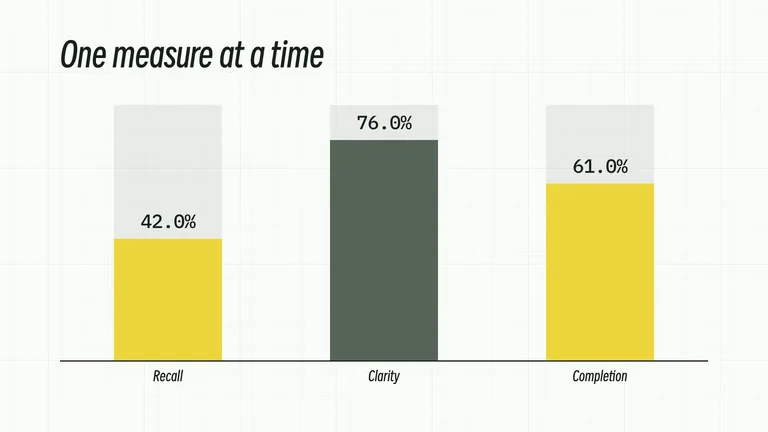
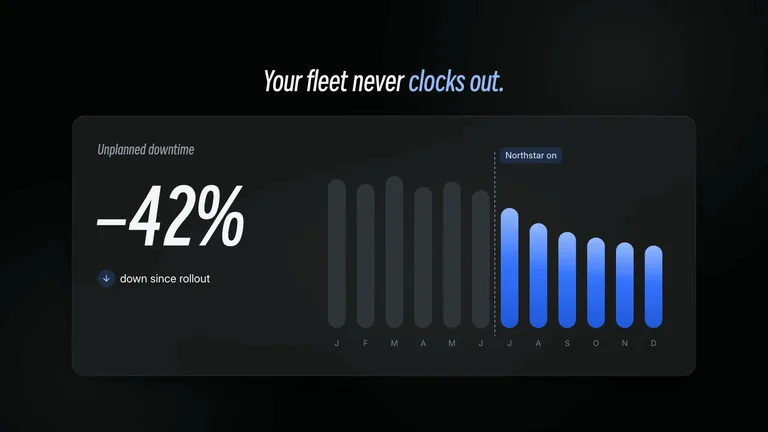
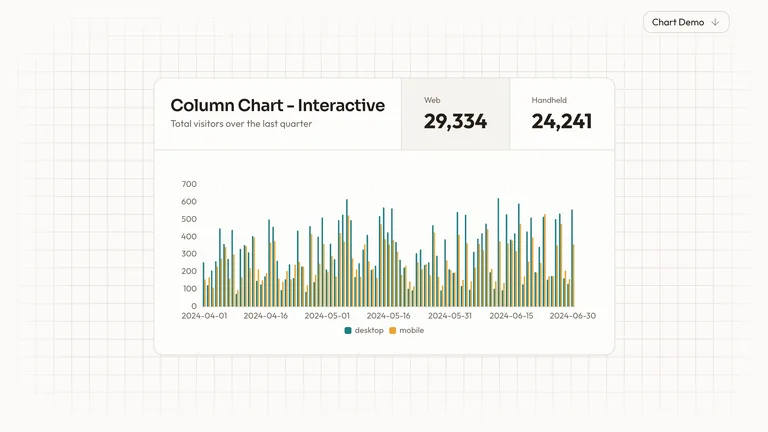
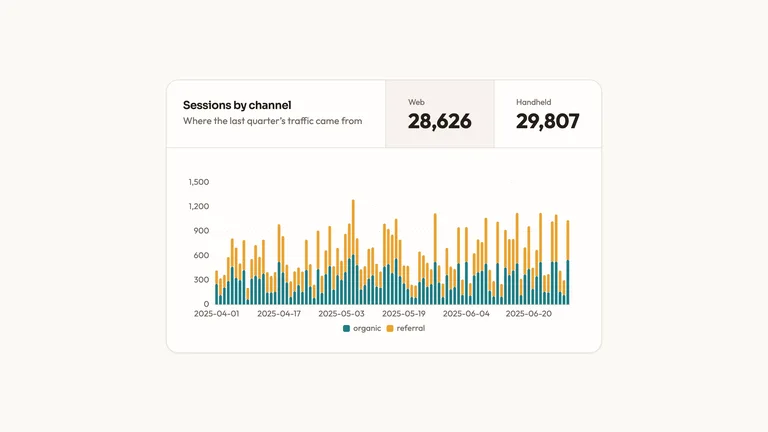
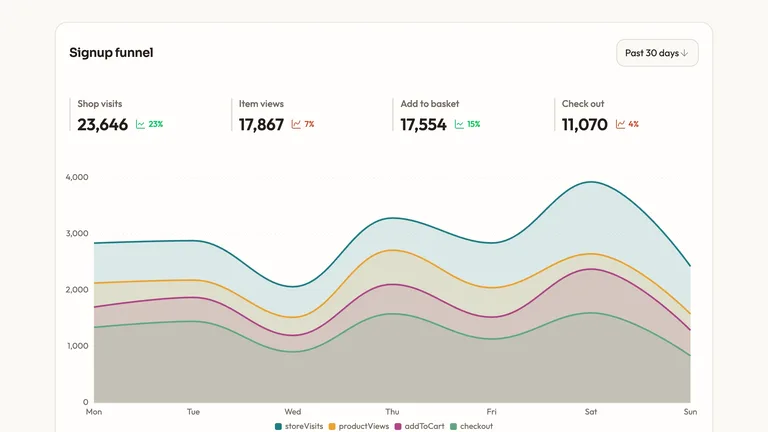
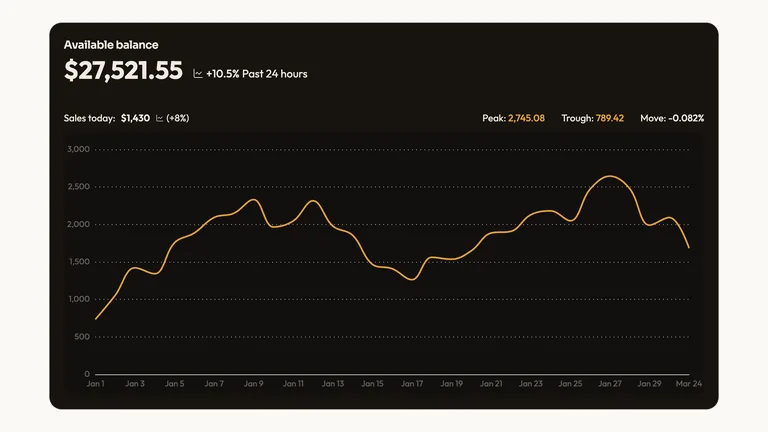
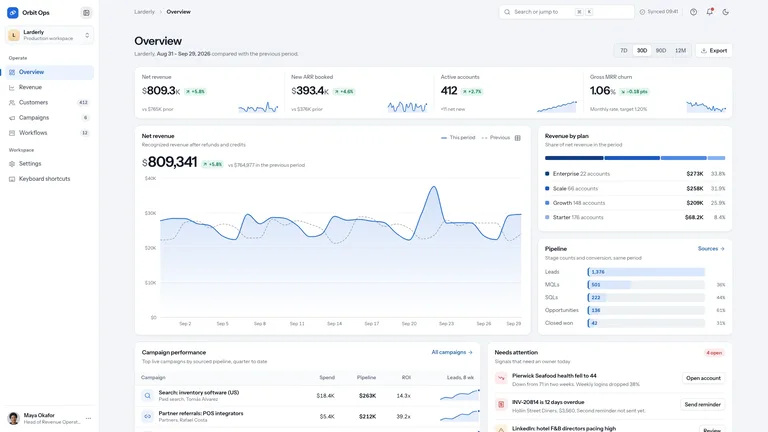
Bar Chart Race, Bars, Line, Area, Pie, Counter, A vs B, and Progress.
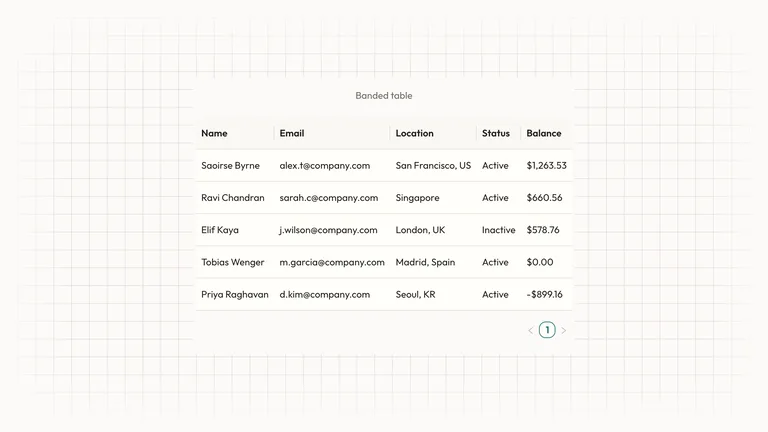
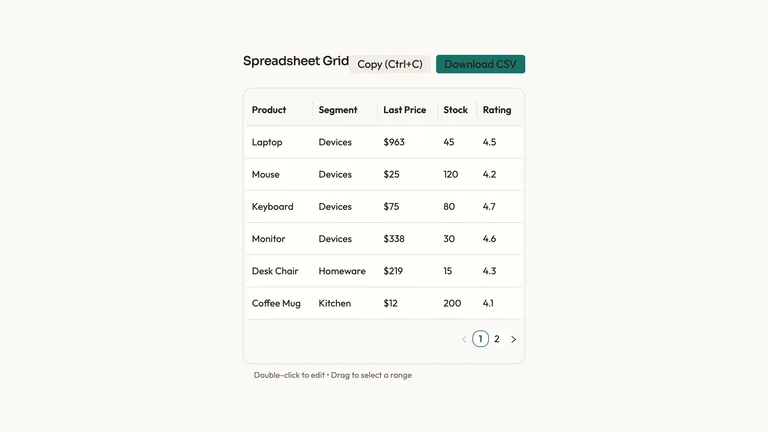
Paste any CSV, edit headers and cells inline, or load sample datasets.
Export 60fps chart animation videos locally or grab vector SVG.
Built for YouTube data essays, LinkedIn posts, SaaS changelogs, and confidential investor updates.

Smoothly interpolate rank swaps across decades or quarters and export straight to MP4 — no Flourish paywall.
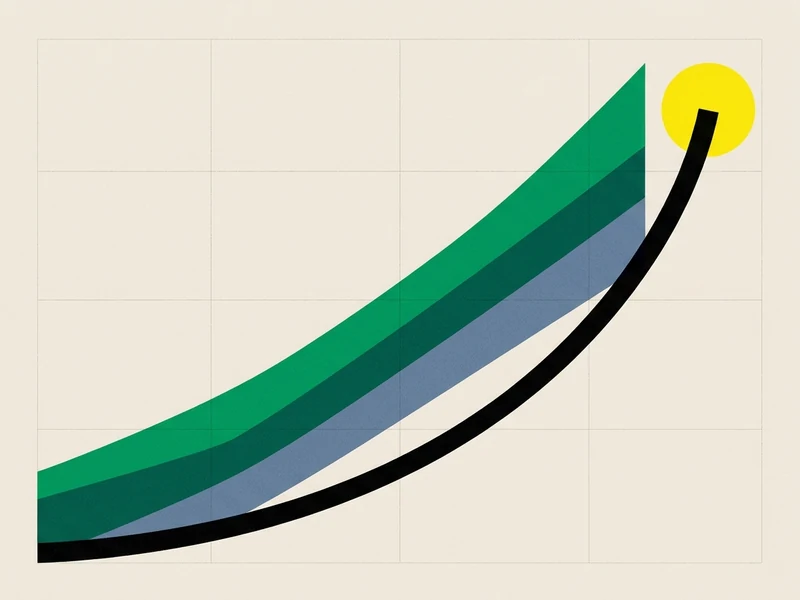
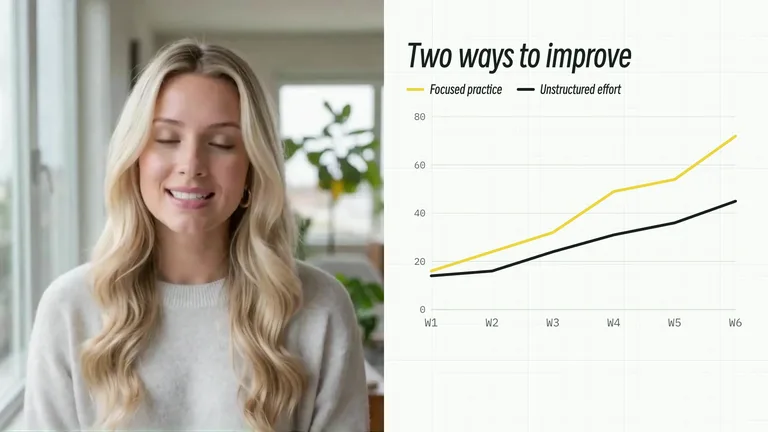
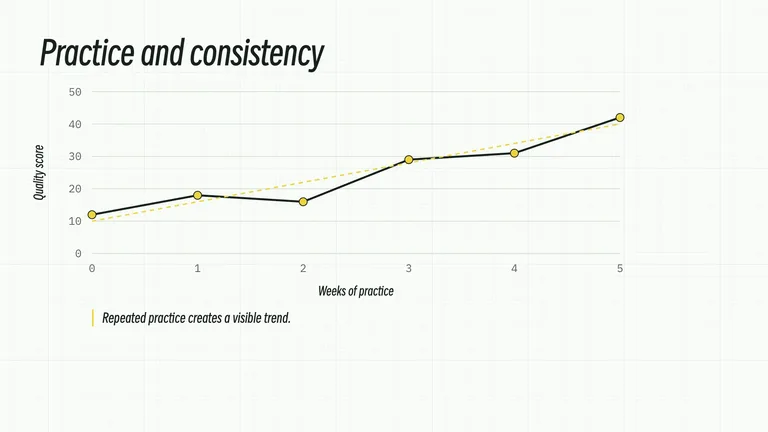
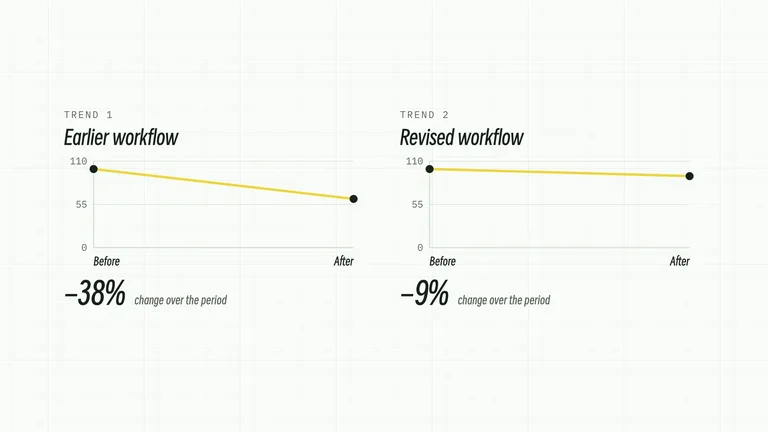
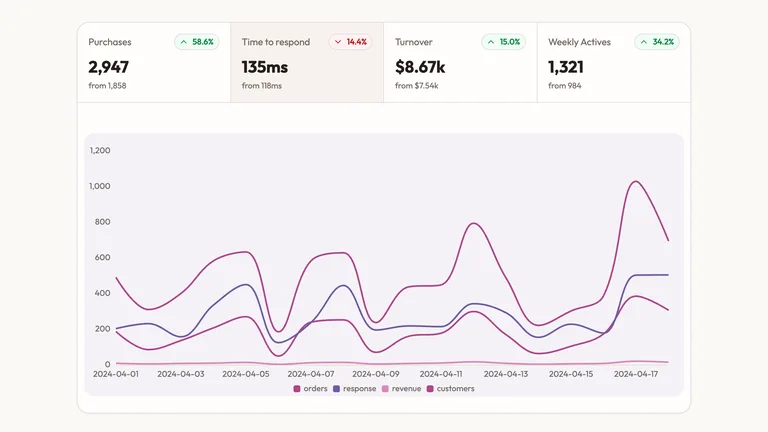
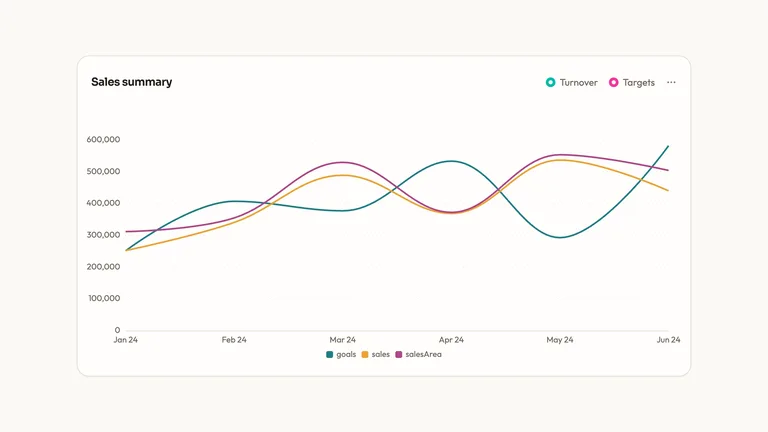
Reveal multi-series growth curves cleanly with end-of-line labels and custom editorial palettes.
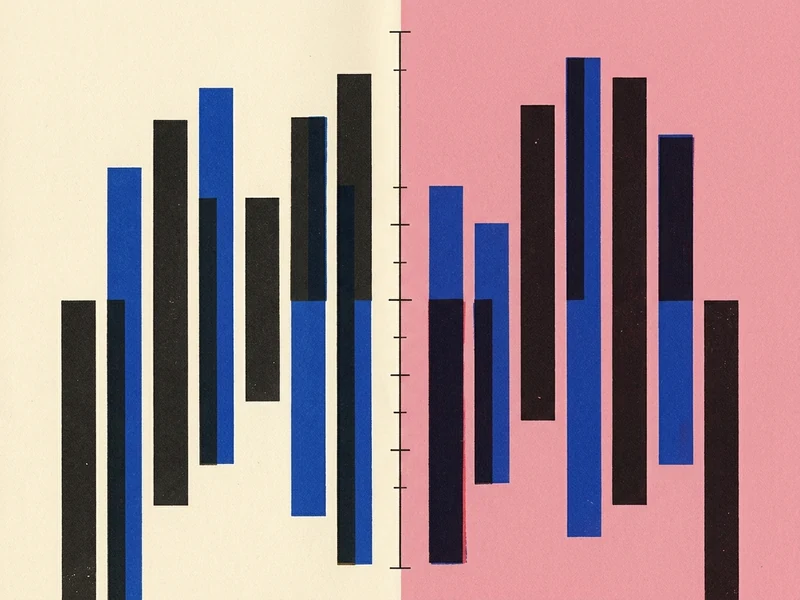
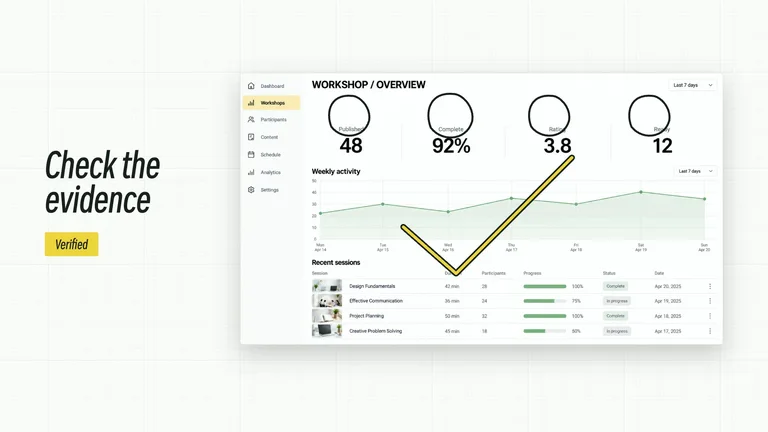
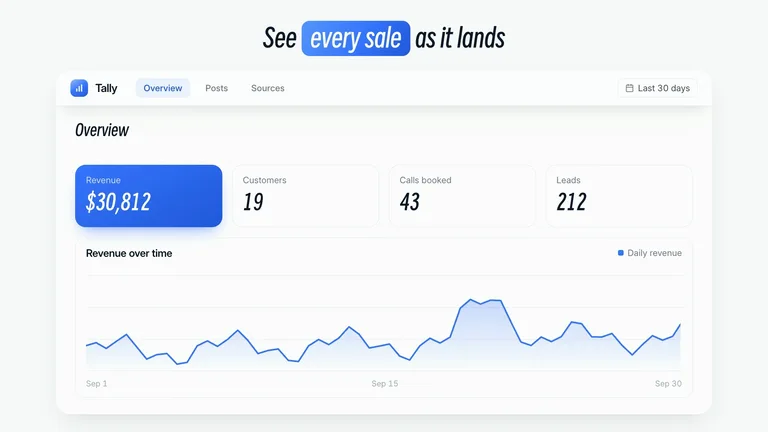
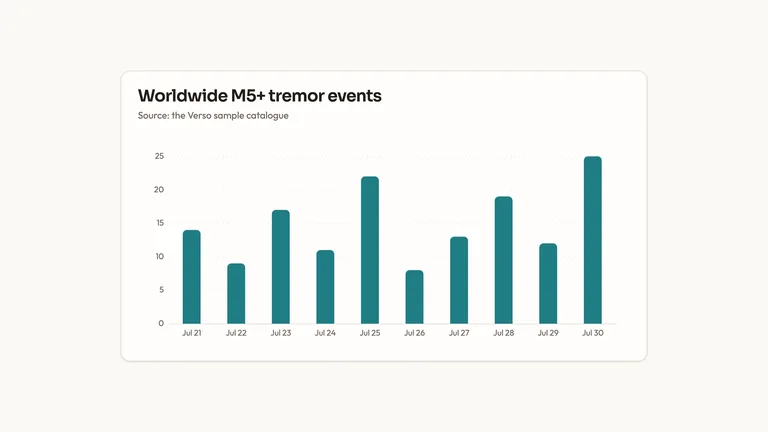
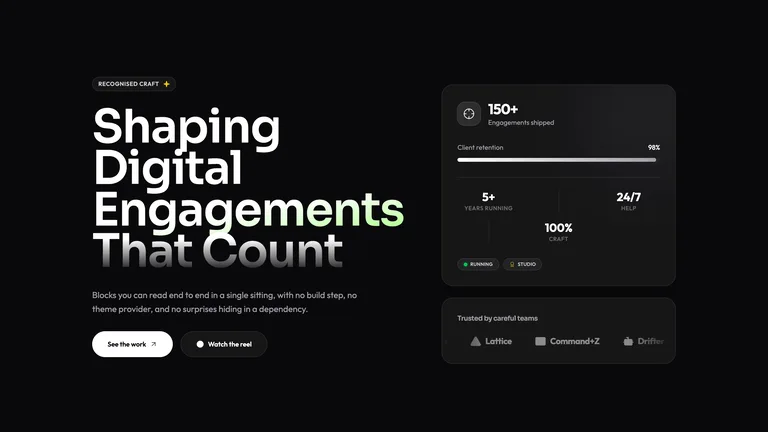
Rank leaders, compare benchmarks, or count up hero KPI metrics in 16:9, 9:16, 4:5, or 1:1.
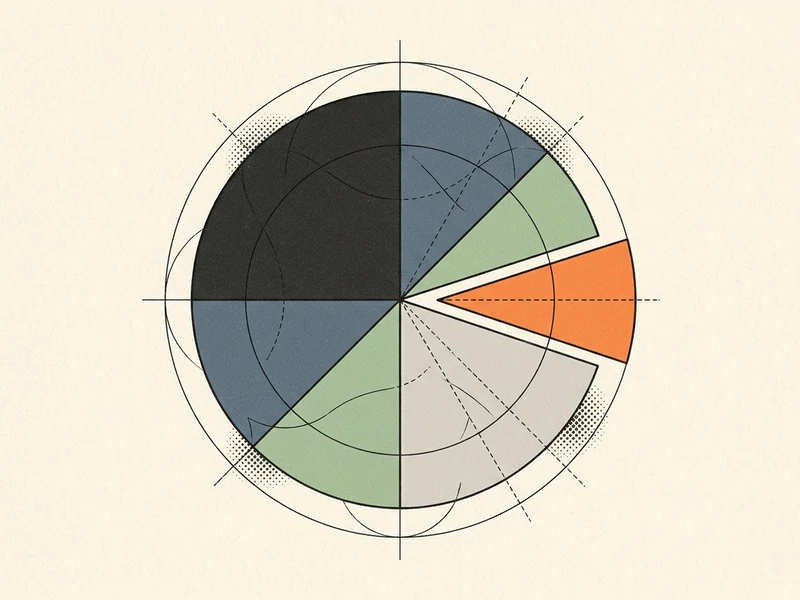
Export transparent WebM α overlays for video editors or crisp vector SVG frames for Keynote and Figma.
 1
Put labels in column 1 and time periods across columns in Data tab.
 2
Switch between Bar Race, Line, Bars, or Counter across 8 themes.
 3
Download watermark-free 60fps chart video or vector SVG locally.
| Capability | Skillry Free Studio | Flourish Free | Datawrapper Free |
|---|---|---|---|
| Direct MP4 / WebM chart video export | Included free | Enterprise plan only | Static / embed only |
| Private local CSV (no cloud upload) | 100% browser local | Public cloud projects | Cloud hosted |
| Transparent WebM α video overlay | Included free | Not supported | Not supported |
| Editable vector SVG + PNG export | Included free | No SVG on free | Paid SVG export |
Yes. Paste your multi-period CSV into the Data tab, preview the smooth bar chart race, and click Export Video to save a watermark-free 60fps MP4.
Flourish requires a paid enterprise plan for direct video export and makes free projects public. Skillry exports MP4, WebM α, PNG, and SVG for free while keeping your CSV 100% private on your device.
Bar Chart Race, Animated Bars, Animated Line Chart, Area, Pie, KPI Counter, A vs B Versus, and Progress — all sharing the same live editable spreadsheet.
Put each category or country in column 1, an optional color group in column 2, and chronological periods (e.g., 2020, 2021, 2022, 2023) in the remaining columns.
Yes. Click WebM α to render a transparent chart animation overlay ready for YouTube essays and product demos.
Yes. Click SVG to download clean editable vector paths, or PNG for high-resolution slides.
Never. Parsing, interpolation, and video encoding run 100% locally in your browser.
Free animated chart & bar chart race maker — export MP4, WebM α, PNG, or SVG.